Tonight
2026-10-13
Fair
Max Kp 4.0
Visible from US/Canada border states and Scotland under dark, clear skies.
Live status — NASA DONKI
Calm — Quiet Solar Conditions
No major space weather currently in progress. The Sun is producing the usual background of low-energy A-, B-, or C-class flares, and Earth’s magnetosphere is undisturbed.
Data from NASA DONKI + SDO. Page rebuilds every 6 hours.
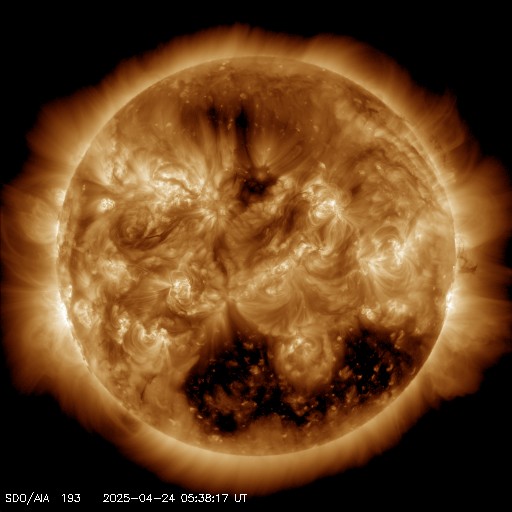
What is happening in space right now? Conditions are calm, with only low-level background flares and an undisturbed magnetosphere. Above is a live view of the Sun, refreshed every fifteen minutes by NASA SDO. Below, a three-night aurora forecast from NOAA and today's Astronomy Picture of the Day. All space-weather data on this page is pulled live from NASA DONKI and rebuilt every six hours.
Based on NOAA's predicted planetary K-index, aggregated to the strongest reading expected during each upcoming night (UTC).
Tonight
2026-10-13
Fair
Max Kp 4.0
Visible from US/Canada border states and Scotland under dark, clear skies.
Tomorrow
2026-10-14
Poor
Max Kp 3.3
Visible only from far-northern latitudes — Alaska, northern Canada, Iceland, Norway.
Thursday
2026-10-15
Poor
Max Kp 2.3
Visible only from far-northern latitudes — Alaska, northern Canada, Iceland, Norway.
Source: NOAA SWPC planetary K-index forecast. Clear, dark skies and a north-facing horizon are required even on a “Good” night.
NASA's Astronomy Picture of the Day, served by Goddard Space Flight Center every day since 1995.
2026-10-13 · NASA APOD
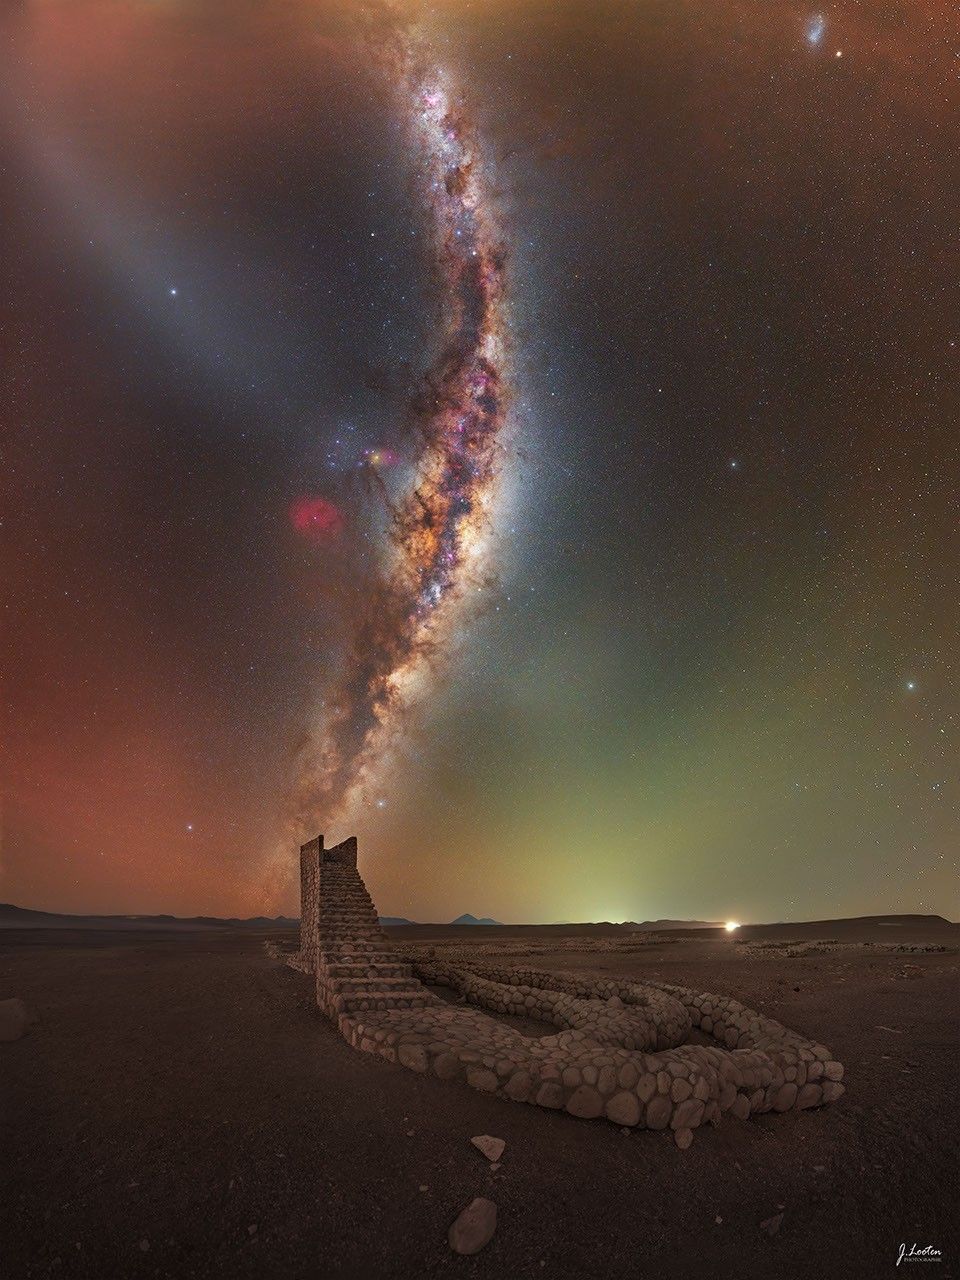
This stairway in Chile brings you only a little bit closer to heaven. But ooh, the sky above it makes you wonder. For example, you may wonder about the dark lane of our own Milky Way galaxy rising behind the expansive Atacama Desert in Chile, the band of zodiacal light on the upper left, the green and red airglow just above the horizon, the star Spica in the zodiacal light stripe, and, at the very top on the right, the Small Magellanic Cloud galaxy. The Desert Staircase sculpture is in the foreground, and this image was timed to catch the picturesque peering perch just in front of the near-vertical Milky Way band. Upon close inspection of the horizon you can find, left to right, some Andes Mountains, the Licancabur volcano, and the town lights of San Pedro de Atacama. The featured wide-angle composite was captured in July 2025.Tomorrow's picture: open space
European Spaceflight
Headlines via the Spaceflight News API — NASA, ESA, SpaceNews & more.
See all space newsNASA DONKI data temporarily unavailable
We could not reach NASA’s DONKI API for this build. The page will retry automatically on the next 6-hour revalidation. In the meantime, you can check NOAA Space Weather Prediction Center directly.
Flares are classified by X-ray peak flux — A and B are background, C is common, M is moderate, X is extreme. M-class and X-class flares can disturb radio communications and trigger geomagnetic storms when paired with an Earth-directed CME.
No solar flares above NASA’s reporting threshold in the last 7 days. The Sun has been quiet.
Source: NASA DONKI /FLR endpoint. Times shown in UTC.
The Kp index measures disturbance of Earth’s magnetic field on a 0–9 scale. NOAA’s G-scale starts at Kp 5 (G1, minor) and tops out at Kp 9 (G5, extreme). Strong storms make aurora visible at lower latitudes and can degrade GPS and HF radio.
No geomagnetic storms recorded by NASA in the last 7 days. Earth’s magnetosphere has been quiet.
Source: NASA DONKI /GST endpoint. Kp values reported by NASA aggregate multiple ground-based magnetometer networks.
A CME is a cloud of magnetized plasma flung from the Sun. Earth-directed CMEs are the main driver of geomagnetic storms, but most CMEs miss us entirely — the Sun is a sphere and Earth is a small target.
No coronal mass ejections recorded by NASA in the last 7 days.
Source: NASA DONKI /CME endpoint. Notes are NASA forecaster summaries.
The Sun image at the top of this page is taken at 193 Ångströms — a wavelength of extreme ultraviolet light invisible to the human eye. What you see is the solar corona, the Sun's million-degree outer atmosphere, glowing with iron ions stripped of most of their electrons. The bright loops are magnetic-field structures trapping plasma; the dark patches are coronal holes, where field lines open into space and accelerate the solar wind. NASA's Solar Dynamics Observatory has been refreshing this image every fifteen minutes since 2010.
The Astronomy Picture of the Day is one of the oldest features on the internet — NASA has published a single, captioned image of the cosmos every day since June 16, 1995. The selection ranges from professional Hubble and JWST imagery to amateur deep-sky photography and the occasional video. The brief caption is written by astronomers Robert Nemiroff and Jerry Bonnell at Goddard Space Flight Center. We pull today's image and the first part of its explanation; the full caption is on apod.nasa.gov.
The aurora forecast cards rate each of the next three nights from Poor to Excellent based on the planetary K-index — a 0–9 measure of geomagnetic disturbance. Higher Kp pushes the auroral oval to lower latitudes. At Kp 3 only Alaska and northern Scandinavia see anything; at Kp 5 the northern US and Scotland come into view; at Kp 7+ the show reaches the mid-latitudes. Latitude is the dominant factor: a “Fair” night in Tromsø is a guaranteed display, while the same Kp at the US/Canada border requires dark skies and a clear northern horizon.
"Space weather" is shorthand for the constantly changing conditions in the volume of space between the Sun and Earth — and across our magnetosphere, ionosphere, and upper atmosphere. The Sun drives almost all of it. Three phenomena dominate the daily weather report: solar flares, coronal mass ejections (CMEs), and the geomagnetic storms they can trigger here at home.
A solar flare is a sudden burst of electromagnetic radiation released when magnetic field lines on the Sun snap and reconnect. Energy that built up over hours is released in minutes — mostly as X-rays and ultraviolet light. That radiation reaches Earth at the speed of light, taking about eight minutes. NASA and NOAA classify flares by their peak X-ray flux: A and B classes are background noise; C is common and harmless to Earth; M is moderate and can cause brief radio blackouts; X is the most intense, capable of triggering wide-area radio interference and, if paired with a CME, strong geomagnetic storms.
A coronal mass ejection is something larger and slower: a billion-ton cloud of plasma and magnetic field hurled into the solar wind. CMEs travel between roughly 250 and 3,000 kilometres per second and take 15 hours to 4 days to reach Earth. Most miss us. Some pass through us and, depending on the magnetic alignment, can pour energy into the magnetosphere and cause a geomagnetic storm.
A geomagnetic storm is what happens when an Earth-directed CME, or a fast solar-wind stream from a coronal hole, disturbs Earth’s magnetic field. The disturbance is measured by the Kp index (planetary K, 0–9). At Kp 5 and above, NOAA assigns a G-scale rating (G1 minor through G5 extreme). Strong storms can degrade GPS positioning, disrupt HF radio used by aviation and shortwave broadcasters, and — most visibly — push the aurora down from the polar circles to mid-latitudes.
Each letter represents an order of magnitude in peak X-ray flux measured by GOES satellites. Within each class, a number from 1 to 9 indicates where in that decade the flare falls — e.g. M5 is five times stronger than M1, and X1 is ten times stronger than M1.
NOAA’s G-scale translates the Kp index into plain-language severity. Higher numbers mean stronger storm currents, brighter and lower-latitude aurora, and more disruption to radio, GPS, and (at the extreme end) power grids.
| Level | Kp | Effect |
|---|---|---|
| G1 — Minor | 5 | Weak power-grid fluctuations; aurora visible at high latitudes (northern Canada, Scandinavia). |
| G2 — Moderate | 6 | HF radio fading at high latitudes; aurora visible as far south as the northern US states. |
| G3 — Strong | 7 | Surface charging on satellites; intermittent GPS errors; aurora visible in mid-latitude states. |
| G4 — Severe | 8 | Possible widespread voltage control problems; GPS degraded for hours; aurora as far south as Alabama. |
| G5 — Extreme | 9 | Possible grid blackouts, transformer damage, HF radio out for days. Aurora visible near the equator. Rare — the May 2024 Gannon Storm reached G5. |
Classical astrology does not have a concept of "solar flare" — the X-ray sensor that lets us measure them only went into orbit in the 1970s. But the Sun has always been central to the system. In Western astrology, the Sun governs vitality, identity, the conscious self, and the will. Periods when the Sun is, astronomically, more active are sometimes read by modern astrologers as a thematic amplification of that solar archetype: a season for clarity about who you are and what you actually want.
A common modern pairing is to read active space weather alongside other transits — particularly Mercury retrograde — as a "double-amplified" reflection period: the Sun stirring up identity questions while Mercury asks you to review what you’ve already said and built. Some astrologers also align CMEs with the more dramatic, change-the-channel transits (Uranus stations, eclipses), reading them as symbolic invitations to release what no longer fits.
None of this is predictive. The honest framing is that space weather is a measurable astronomical phenomenon, and the astrology layer is a reflective tradition that pairs an external rhythm with internal practice. A C-class flare is not "going to" do anything to your week. But the act of noticing solar activity, in tradition, can be a useful anchor for asking: where am I overheating right now, and what wants to slow down?
Space weather is a real, measurable phenomenon — and like astrology, it is surrounded by overclaims. None of the following are supported by current science.
"Solar flares cause earthquakes."
No scientifically established connection. Studies looking for correlations between solar activity and seismic events consistently find no causal mechanism and no statistically robust relationship. Earthquakes are driven by tectonic stress; solar flares are electromagnetic phenomena. The two are not physically coupled.
"Geomagnetic storms make people irritable."
Weak and inconclusive science. A handful of older epidemiological studies report tiny statistical associations with things like headaches, hospital admissions, or heart-rate variability, but the effects are small, inconsistent, and contested. There is no established mechanism by which a geomagnetic storm at the magnetosphere alters human mood.
"Space weather is dangerous to humans on Earth."
For almost everyone, no. Earth’s atmosphere absorbs the X-ray and UV burst from flares, and the magnetosphere deflects most of the charged particles from CMEs. The genuine risk groups are astronauts (especially on spacewalks), high-altitude polar-route pilots and aircrew (slightly elevated radiation dose on the strongest events), and operators of GPS- or HF-radio-dependent systems.
"Solar flares are part of an astrology prediction."
No — they are astronomy, not astrology. Flares can be measured, classified, and predicted within statistical bounds. The astrological framing on this page is a tradition layered on top of that astronomy — a way of paying reflective attention, not a forecast about your life.
We pull this page from NASA DONKI on a 6-hour cycle. If you want real-time updates or aurora alerts, these are the primary feeds the rest of the field uses.
No — conditions are currently calm. The Sun is producing only low-level background flares and Earth’s magnetosphere is undisturbed. No flares above NASA’s reporting threshold appear in the current data window. For people on the ground, even strong space weather rarely produces direct health effects — Earth’s atmosphere and magnetosphere shield us. The exceptions are astronauts, high-altitude pilots on polar routes, and radio/GPS-dependent systems.
A solar flare is a sudden burst of electromagnetic radiation (mostly X-rays and UV) from the Sun’s surface — it arrives at Earth in about eight minutes. A coronal mass ejection (CME) is a cloud of plasma and magnetic field hurled into space; it travels much slower (one to four days to reach Earth) and is what actually drives most geomagnetic storms and auroras. Flares and CMEs often happen together, but not always.
There is no strong scientific evidence that solar flares or geomagnetic storms directly affect human mood. A small body of older research has suggested very weak statistical correlations with things like headaches or sleep disruption, but the effects (if real) are tiny and disputed. In Western astrology tradition, periods of heightened solar activity are sometimes treated as a symbolic invitation to slow down — but that is reflective framing, not measured cause and effect.
The strongest flare in the modern monitoring era is the November 4, 2003 event, estimated at roughly X45 (the X-ray sensor saturated, so the exact peak is reconstructed). For comparison, anything above X10 is considered an extreme event. The 1859 "Carrington Event" is believed to have been even larger, but predates direct X-ray measurement.
Solar Cycle 25 peaked around 2024–2026 — we are at or near solar maximum right now. That is why X-class flares, CMEs, and visible aurora at lower latitudes have all been more common in the last two years. Activity will gradually decline through the late 2020s before the next minimum.
During solar maximum, X-class flares typically occur a few times per month. During solar minimum, they may go many months between events. Solar Cycle 25 has produced an unusually high number of X-class flares for a moderate-amplitude cycle.
Yes — geomagnetic storms produce the aurora borealis (north) and aurora australis (south). During the strongest storms (G4 or G5), aurora can be visible at mid-latitudes, sometimes as far south as the northern United States, the United Kingdom, and parts of central Europe. NOAA SWPC and apps like "My Aurora Forecast" can warn you when conditions are favorable.
Astronomically, no — there is no measured causal link between solar flares and the symbolic systems of Western astrology. In tradition, however, many astrologers treat heightened solar activity as a thematic echo of the Sun’s archetypal role (vitality, ego, identity) and pair it with transits like Mercury retrograde to suggest a reflective, slow-down period. We label that clearly as tradition, not prediction.
Mercury Retrograde
Live status + 2026 dates
Moon Phase Today
Current lunar phase
Eclipses 2026–27
Next solar & lunar eclipses
Birth Chart
Your personal Sun & planets
This page is editorial. Live space weather data comes from NASA DONKI. The astrology framing is traditional Western symbolism, presented as reflective practice — not prediction. See our AI disclosure for editorial standards.